Since Numbers Never Lie Now What San Diego?
The data for 2013 and for the period 1/1/2014 through 06/30/2014, was received in September and subjected to my analysis[1]. Although, I am no mathematician, I am confident that in no dismal metric was the experience of Blacks and Hispanics excelled or exceeded by that of any other group. When the examined metric suggested law-obeisance, the opposite was sometimes true.
To begin, and to repeat, every representation made to each of you and to all of us, as to the ability of San Diego to identify the ethnic make-up of the driving public, is nonsensical and false. That information exists, and has always existed, and the City has used it in one or more past reports. Furthermore; it may be reflected in San Diego’s data (at least since 2000.) The fact that stop ratios do not correlate to, or with, census values or estimates shows that something is amiss.
If any assert that those overrepresented in San Diego’s data have larger driving populations, I suggest that they should ride the bus and while doing so assign a racial category for each passenger. That should disabuse them of those ideas.
In truth, driving-public ethnicity information is really of no practical use; none that I can think of. To borrow and use an expression of a lawyer with whom I am unhappily acquainted, it is a red herring. Please do not revisit that bit of false useless foolishness.
Ferguson
Once again, San Diego’s values were compared to Ferguson, MO, due to the topical nature of occurrences there and pronouncements or questions made and raised here, in San Diego.
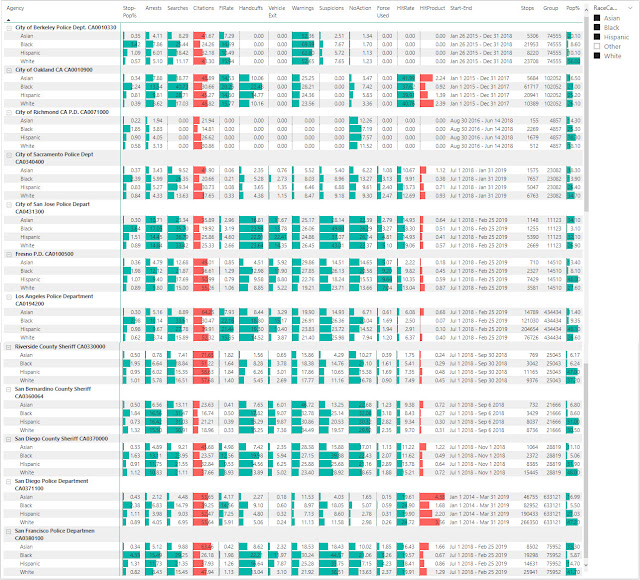
· The "Disparity Index" measures the likelihood drivers of a given race or ethnic group are stopped based on their proportion of the residential population age 16 and over. Values greater than 1 indicate over-representation and values less that 1 indicate under-representation in traffic stops.
The San Diego data is limited to, and presented for, the data period shown, because San Diego, invoking or playing “the burden card”, has refused to provide data for 2002 through 2012. Additionally (and in anticipation); please be advised that your IT Manager, Haley, has opined that the 2013 data is a valid or representative sample. I agree.
Like it or not, Ferguson is the datum or standard against which the SDPD is being measured and, regrettably, San Diego is left looking up to Ferguson. Ferguson’s Disparity Index, for the year ended 2013, is 1.37. San Diego’s sits at 1.60 (mean 1.46), trending downwards. Accordingly, the results are unflattering but encouraging, because of the trend, as is shown by graphic presentation of San Diego’s data.
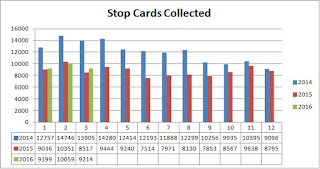
The graph shows that the late summer surge, in stops and its consequences, affecting Blacks and Hispanics corresponds to the time of public complaints or outcry, and “community outreach” or similarly characterized meetings, held by the SDPD (supported by your internal communications.) The data also demonstrates that as the Blacks received increased attention, the SDPD reduced its pressure on other groups. Most tellingly, and positively, the pressure on Blacks abated coincidental with the appointment of Chief Zimmerman. However, the damage was done.
I have chosen to discuss and demonstrate a single metric. As is shown, more than 20 exist. (Those that may appear to be duplications are not.) Inventory Searches and Fourth Waiver Searches are particularly revealing. Incidentally, more than half of the data, recently made available, had been previously withheld or concealed, from all of us; those external to the SDPD.
Finally; in examining this data, it occurred to me that the possibility exists that every racial or ethnic group was profiled. Nothing else explains the preference/deference afforded to, or results of, the so-called “model” minority.
I expect to be looking at the third quarter of 2014 soon.
So, Chief Zimmerman, while I cannot say whether or not you will or do tolerate racial profiling, it is beyond dispute that you do have Racial Profiling being practiced by your department. Nothing displays that more than your department’s data and Lieutenant Stephanie Rose’s memorandum advocating it. Please ensure that, if implemented, the practice she advocates is discontinued immediately; because, unless I am mistaken or “misremember”, certain members of the City Council asked for a cessation of that old practice, now being re-advocated by the lieutenant. I believe that a documented promise was extracted from your department, to that end. Please ignore this if your professionals have divined a way to identify parolees, on sight, where race is not an input parameter.
So proceed buttressed by the fact that your data shows that, under your leadership, the SDPD appears headed in the right direction; although the abiding disparate impact of the ingrained practice and policies shines plainly still.
My regards to Detective Mosteller and all those who sought, and continue to seek, to dissuade and discourage me.
Thomas Eric Duncan died this morning. Over the weekend, Mrs. Hylton asked why he was turned away on his first visit to the hospital and why, once admitted, he was not given the experimental drugs given others. I gave her a look, the meaning of which she understood. Jesse Jackson, the lightening rod, the irritant, the man that some love to hate, asked and answered the same question yesterday morning. "He is African and his life is not quite as valuable."
[1] The use of the group Other is problematic. The census has a precise definition for “Other”; here all values that are mis-coded or unrecognized are dumped into “Other”. Furthermore, I have made no attempts to verify the search counts against the search details. Details may have multiple search items per stop. I may do so later, if need be.
According to the 2010 census, the racial makeup of San Diego was 45.1% White, 6.7% African American, 0.6% Native American, 15.9% Asian (5.9% Filipino, 2.7% Chinese,2.5% Vietnamese, 1.3% Indian, 1.0% Korean, 0.7% Japanese, 0.4% Laotian, 0.3% Cambodian, 0.1% Thai). 0.5% Pacific Islander (0.2% Guamanian, 0.1% Samoan,
0.1% Native Hawaiian), 12.3% from other races, and 5.1% from two or more races. The ethnic makeup of the city was 28.8% Hispanic or Latino (of any race); Total 1307402. No attempt was made to determine age.
Comments
Post a Comment