Do not go to San Francisco, but if you do screw the flowers.
January 18, 2018
The Honorable London Breed
Acting Mayor and
President Board of Supervisors
1 Dr. Canton B. Goodlett Place
San Francisco, CA 94102
The Honorable Suzy Loftus
President Police Commission
1245 3rd Street
San Francisco, CA 94158
The Honorable Susan Christian
Chair San Francisco Human Rights
25 Van Ness Avenue, Suite 800
San Francisco, CA 94102
William Scott
Chief of Police
1245 3rd Street
San Francisco, CA 94158
Ronald
L. Davis
Director
Office of Community Oriented Policing Services
U.S. Department of Justice
Office of Community Oriented Policing Services
145 N Street NE
Washington, DC 20530
Office of Community Oriented Policing Services
145 N Street NE
Washington, DC 20530
Dear Mayor, Supervisor, and Commissioners;
“If there be an object
truly ridiculous in nature, it is an American patriot, signing resolutions of
independency with the one hand, and with the other brandishing a whip over his
affrighted slaves.” B. Banneker.
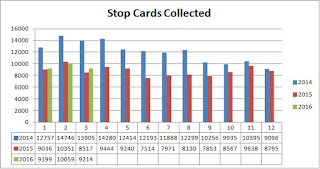
The following is an arithmetic
analysis or stratification of vehicle stop data, collected by the city of San
Francisco for the period, January 1, 2014 through December 31, 2017. It is unadorned by deception. These are raw
numbers; measurements. This report was begun before it was known that the
US-DOJ had undertaken and completed a study that included analyses of traffic
stops, in November 2016; a serendipitous fact for this report confirms, to some
extent, the US-DOJ findings, even as it roundly rejects the methodologies used,
by the Federal Government. The US-DOJ's benchmark for denominator selection is for the transparent purpose of diminishing
abominable disparities. It is rejected and if you understood it, you would reject it too.
The dataset used in these measurements is offset 6 months into the future from that used by the USDOJ (Dec 2014-Dec 2016 vs. May 1, 2013–May 1, 2016.) The number of records are 348, 544 vs. the 331,829 used by COPS. All outcomes, as appears on each record, have been included in this analysis; i.e. there is no mutual exclusion, since experience shows that motorists are sometimes subjected to multiple post-stop outcomes; I have seen as many as eight (8.)
The dataset used in these measurements is offset 6 months into the future from that used by the USDOJ (Dec 2014-Dec 2016 vs. May 1, 2013–May 1, 2016.) The number of records are 348, 544 vs. the 331,829 used by COPS. All outcomes, as appears on each record, have been included in this analysis; i.e. there is no mutual exclusion, since experience shows that motorists are sometimes subjected to multiple post-stop outcomes; I have seen as many as eight (8.)
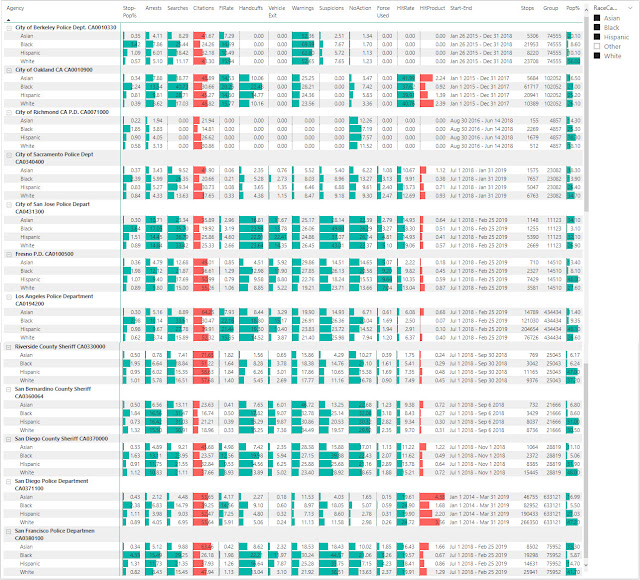
The Basics
Figure A

The above is, for the most part,
a reflection of unvalidateable SDPD-provided data. In the absence of record
identifiers (Incident Numbers) consistency tests were impossible. I daresay
that it gives me pause as I contemplate, and seek, and fail to find a valid
reason for the removal of Incident Numbers. The invalid uselessness of Stop
Time, in one or more of the data sources, was equally troubling. As a result, data
reliability is unknown. Indeed, the data that the SDPD provides fails
every data reliability test that the city espouses and recommends.[1]
Some categories of Stop Causes and Results of Search may seem to be duplicative. They are not. They
are the result of the SDPD using three discrete data collection systems, and of
the failure to use common data, across those systems, to drive dropdowns or
checkboxes.[2]
Accordingly, we have values like BOLO /APB / Warrant being made separate from
BOLO/APB/Warrant; white-space matters.
Something somewhat-similar is true for “Search as a result of Probation
or Parole” and “Searched as a
result of Probation or Parole”; spelling matters. Sometimes the search results
are embedded, at others they are not.
Granularity is achieved and
illustrated in the below dashboard-like presentation of stop and post-stop
outcomes.
My View and Measurements
This story is told through the
use of visualizations, where the charted values are embedded or adjacent,
rather than dispersed, as was done in a report prepared by a team of 18 COPS “experts.”
San Francisco’s Standard Post-Stop Items 2014-2016
Figure B

Figure B2- Comparative disparities to Whites

1. SAN
FRANCISCO PD officers stopped (2.50 to population), searched, arrested, and
cited (2.04 to population) more Blacks (and Hispanics, to a lesser extent) by
proportion, than Whites. These findings remain constant, and so significant,
over a span of years.
Figure C

Figure C

2. SAN
FRANCISCO PD officers stopped, searched, arrested, and cited fewer Asians than
Whites to population.
3. The trend
in adverse consequences for post-stop encounters shows worsening for Blacks and Hispanics.
4. The
extraordinarily low citation-to-stops rate for Blacks is the result of an
extraordinarily disproportionately high number of stops; the denominator effect
on records (inverse). The inability to issue citations that are proportional to stops,
that could survive judicial scrutiny and validation are strong indicators of
bias in stops.
5. The stop
disproportion for Blacks, by far, outstrips that of all other groups.
6. Some 14.70%
of SAN FRANCISCO PD stops were of Blacks, who make up 5.87% of San Francisco’s
population. When compared to the inverse disproportion enjoyed by Whites and
Asians, Black stop disproportion is astronomical.
7. Asians are
33.3% of the population but compose only 17.58% of stops; an inverse disparity to population, and to
Whites.
8. Whites are
41.70% of the population but compose just 37.33% of stops; an inverse disparity.
9. Hispanics
are 14.70% of the population but compose 13.12% of stops; an inverse disparity.
10. Many stops
continue to appear to be motivated by a “Hit”-driven desire to determine the
parole or probationary status of individuals who were predominantly Black or
Hispanic. However, there is no data to show how SAN FRANCISCO PD is able to say
how such persons —those subject to 4th Waiver searches— may be
identified. The disparities shown by these data are strongly suggestive that
race is the basis of “identification.”
11. Except for
a relative few values, recent evaluations of post-stop outcomes show that
Asians enjoy a favoured status with the SAN FRANCISCO PD. Many disparities are
inverse (based on values less than), to those of Whites.
12. All
disparities between Blacks and Whites are massively statistically significant,
spurious methodologies and covariates as employed by the USDOJ, notwithstanding.
13. The City
of San Francisco has offered no explanation for its failure to conform to the
requirements of the California Public Records act with respect to its failure
to include data for the 3rg Quarter 2017. Despite that data being available (it
being the basis for San Francisco’s own report) that data was not provided. No
explanation for the denial of data was provided.
Bias in the Benchmarks
I turn to the COPS prepared
report for the City of San Francisco. The raw numbers —when they can be found
in the COPS product, as in Table E.4—
are not at significant variance with my computations; see Figure B.
Accordingly, in net-effect, my examination tells the same story as was told by
COPS, but it does so without the silliness of systemically-biased covariates
(page 69 and 303 et seq.) based on officer-apportionment/assignment of blame
for the accident and reporting. The COPS analysts claim:
“Not-at-fault drivers served as an estimate of the driving population
in the city, while at-fault drivers served as an estimate for those who violate
traffic laws. If SFPD officers disproportionately stop minority drivers, a
higher percentage of minority stops would be expected compared to the
percentage of minority drivers involved in traffic collisions.”
And it is curious that Whites do
not get this treatment in the computation of driving population. We are about the business of computing
disparities are we not? Yes, the COPS report reads like an exercise in
defining disparities down.
Such benchmarks, as used here,
attempt to reduce black stop disparities to make them seem more palatable[4],
and in doing so, they ignore the Reporting Biases — the selective
revealing or suppression of information—that are rife and rampant, where Blacks are concerned. Moreover,
over and above the foregoing, attribution or assignment of blame for accidents,
by LEAs, suffers from the same biases that these studies seek to identify and
eradicate; a famous case and comment from Michael Mann:
As to the Palm Beach
Gardens Police Department, it correctly changed its initial conclusion on
account of obtaining and analyzing new evidence. Still, Williams might object
to the police so unwaveringly blaming her in the first place: the statement,
“THE DRIVER OF V1 IS AT FOR VIOLATING THE RIGHT OF WAY OF V2” in the traffic
crash narrative left no room for debate at a time when the existence of
video evidence had yet been ruled out, let alone studied.
Michael McCann is SI’s legal analyst. He is also an attorney and
the Associate Dean for Academic Affairs at the University of New Hampshire
School of Law.
The obtaining and analysis of
“new” evidence, doubtless, were driven by the resources that are at the disposal
of Venus Williams.
Michael McCann’s observation is
of a commonplace occurrence and points to pre-judgment of the type that should
be beneath an august organization, such as COPS[5],
but here we are. The absence of nous in 18 “experts” is “shining plain”, other
troublesome and concerning things are not, and they are not concealed either.
The obvious refutation and exposure of the sophistry in this biased LEA
“benchmark” is the ridiculously low-citation rates “enjoyed” by Blacks. People who cause accidents get tickets and
the Blacks get fewer tickets than all, by rate to actual population.
To close this chapter: the expert
analysts from COPS; the US-DOJ want us to believe that the people who
traditionally have occupied the lower rungs of the economic ladder have a
higher rate of possession of cars. They could have done better by driving by
bus stops or by riding buses while counting riders by these examined groups.
Doubtless you have seen the SFPD-prepared
report
that conforms to the requirements of Admin. Code SEC. 96A.3 (a) (6) and I hope
are alarmed by what it portends. That report, as presented, told me little
or nothing. That is because it showed percentages and nothing else. Indeed,
given the actual differences in population percentages for the examined groups,
all things being equal, we should expect that Whites and Asians should always
have the highest percentages; so what? Rates are the answer or remedy. For that
reason, I manually entered[6]
some of its data for the purpose of computing rates and raw disparities. My visualization-based
measurements show said disparities for the 3rd Quarter[7].
They tell us that little has changed, other than the stop-disparities for Blacks have sky-rocketed in this
third quarter, when compared to the prior three years.
Figure D

The overall disparities are
trending adversely to the interest of Blacks. The raw disparity to local
population percentage, for the Third Quarter, is up to 3.39 from the 2.50 that
was computed for 2014-2016. I daresay that there are no convenient accident reports to water-down this massive disparity.
Figure E

Figure E

Figure F

Finally; Admin. Code SEC. 96A.3 (a) (5) requires
collection of: The race or ethnicity, sex, and approximate age of (A) all
individuals subject to the Detention, (B) the driver of a vehicle stopped
during a Traffic Stop, and/or (C) the passengers of a vehicle stopped during a
Traffic Stop, if the Officer has
reasonable suspicion to detain such passengers. The Officer may collect
information on age and sex by verbally asking the individual or by requesting
to see identification. The Officer may collect information on race or ethnicity by verbally asking the
individual…
1. The Supreme Court, 10 years
ago, in U.S. Supreme Court decision in Brendlin v. California, --- U.S.
---, 2007 WL 1730143 (June 18, 2007) decided that passengers are detained during traffic stops. Data must be collected for each occupant.
2. RIPA prohibits questions on race or ethnicity being directed
to detainees.
Administrative Code,
SEC. 96A needs revision.
Ignorance, allied with power, is the
most ferocious enemy justice can have,—James Baldwin
There is much evidence of ignorance
in the COPS analysis; the reaction (or lack thereof) to it, and the
Administrative Code that gave birth to it. But what impresses most is the desire to avoid Federal oversight of the operations of the SDPD. In that regard, the signal lesson of the University of Michigan is instructive.
[1] https://datasf.gitbooks.io/datasf-guides-data-quality/content/step_1_collect_needs_and_requirements.html
[2]
The eStops table contained 4855 records. One record was populated by NULLS. 331,829
[3]
Disparities in stop, arrest, and search data between ethnic or racial groups in
the city and county of San Francisco persist. The assessment team’s analyses of
the SFPD’s traffic stop data reveal disparities related to the SFPD’s issuance
of warnings, citations, arrests, and searches based upon racial and ethnic categories.
The SFPD’s data demonstrate that African-American drivers are more likely to be
warned, arrested, and searched than White drivers, and Hispanic drivers are
more likely to arrested and searched than White drivers. https://www.sfdph.org/dph/files/jrp/DOJ-Report.pdf
page 61.
But see the disgraceful methodology — based on at-fault reports by California LEAs—
used by the US-DOJ to rationalize and diminish the 250% disparity. See https://www.sfdph.org/dph/files/jrp/DOJ-Report.pdf,
at page 297: Not-at-fault drivers served
as an estimate of the driving population in the city, while at-fault drivers
served as an estimate for those who violate traffic laws. If SFPD officers
disproportionately stop minority drivers, a higher percentage of minority stops
would be expected compared to the percentage of minority drivers involved in
traffic. By implication, California LEA’s find Blacks to be at-fault around
3 times as often as Whites. Venus Williams, initially found
at-fault by a LEA, due to her race, a common experience for Blacks, does not
live in California. Venus Williams has resources.
Reports and judgments by California LEAs are the issue.
Again, the tone-deafness or cynical nature of the US-DOJ using a
blame-apportionment benchmark as a tool, to diminish disparities, is
disgraceful, astounding but not surprising. Those comedians suggest that Blacks
though only 5.7 of population, are 12% of the driving population. Right! I suggest that they drive pass bus
stops in San Francisco.
Also unsurprising is the
failure to explain the effect of the high Black stop rates on the low Black
Citation rates; a condition contrapositive to the COPS-embraced methodology
that suggests that the people at the bottom of the economic scale drive more;
transparent bigotry. More productive
would have been an explanation of the quite self-evident that the low citation
rates “enjoyed” by the Blacks; the result of the inverse relationship between
stops and citations. On this matter the US-DOJ chose silence when words would
matter. Doubtless it is clear to them (COPS) that citations were not being
issued to blacks (16.04 points below the mean) because the judiciary would not
have sustained them.
[4]
The inadvisability of using self-reporting data (At-fault traffic accident reports) from a source that is itself
being investigated for bias, to
validate, authenticate or to be the basis of a measurement methodology, is
cynical at best, scandalous at worst. To this analyst, it is flabbergasting and
he heartily recommends the recent experience of Venus Williams and The
New Jim Crow as remedies. See also Reliability of
self-report data @http://www.creative-wisdom.com/teaching/WBI/memory.shtml.
[5]
Here, the bias shows that COPS it is more than an acronym or abbreviation; it
is a form of self-service.
[6]
The SDPD failed to provide the data that it used in its report, despite
receiving a lawful request for it.
[7]
Page 6 shows the number of Traffic stops to be 24, 682, but the computed total
is 24,862.
Comments
Post a Comment